Research Analysis Bar Chart
The Research Analysis Bar Chart is similar to the Analysis Graph. However, it displays the search results with the total number in each class as simple bars, without the distribution across the search range.
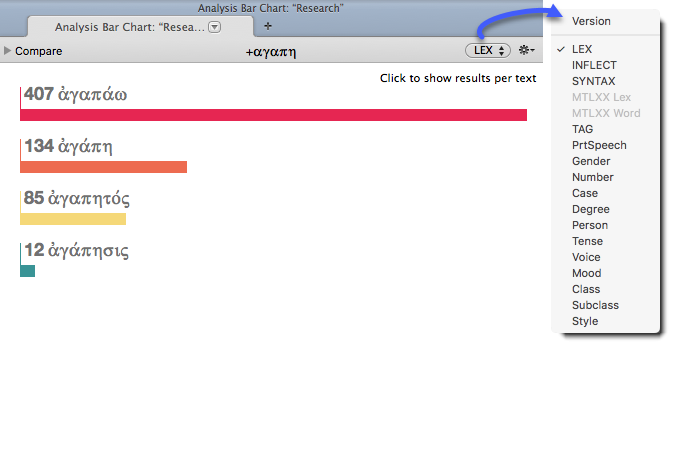
This example shows the results of searches for all forms derived from the root![]() A root is a unit of a language that cannot be further divided, from which words are derived by modification. The root does not necessarily survive as a word in itself. The Accordance roots may combine homographs and therefore a single root may include roots with different etymologies and meanings. In Hebrew, by convention, the lexical form (lemma) of a verb is the same as the root. agape in the Greek New Testament and the LXX, broken down by the Lexical forms found.
A root is a unit of a language that cannot be further divided, from which words are derived by modification. The root does not necessarily survive as a word in itself. The Accordance roots may combine homographs and therefore a single root may include roots with different etymologies and meanings. In Hebrew, by convention, the lexical form (lemma) of a verb is the same as the root. agape in the Greek New Testament and the LXX, broken down by the Lexical forms found.

- Each bar is labeled with its name and a number count.
- The text on the top of the Bar Chart tab displays the search argument.
- Class pop-up menu (upper right): Used to choose a different class to analyze.
- Up to 128 bars can be displayed at once, in up to 4 columns.
You can drill down to explore how each text contributes to the totals displayed in the Analysis Bar Chart tab.
-
Click a bar or its text label. The Analysis Bar Chart now displays the individual contribution of each Text to the total.
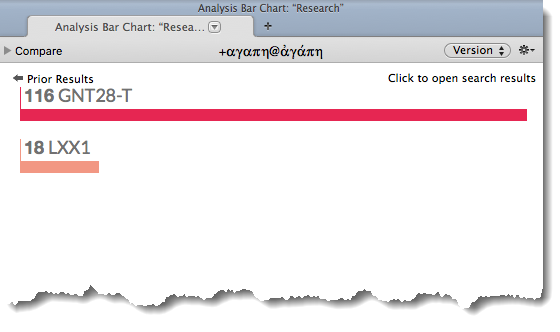
In the example below, clicking on agape displays the total hits for the GNT and the LXX:

- Click a bar or its text label. A new Search Tab opens displaying the results of search for agape in the GNT28-T.
- The Class pop-up menu can be used to further analyze the search results. Click INFLECT in the Class pop-up menu. Inflected forms are displayed.
- Click Prior Results to return to the original aggregate search display.
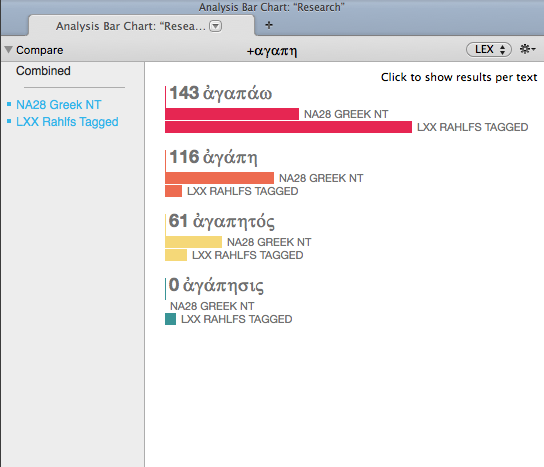
- Use the Compare browser to reveal the contribution of one or more Texts to the total search.
- Click the Compare button (
 ). The Compare browser opens revealing the search Texts.
 - Click one or more items in the browser to select them. The selected items are highlighted and displayed in the Analysis Bar Chart window.
In the example below, NA28 Greek NT and LXX Rahlfs Tagged have been selected. The contribution of each selected item to the total is displayed:

You can change the default display of the bar chart.
-
Right-click within the Bar Chart and choose Set Graph Display. The Set Analysis Bar Chart Display dialog box appears.
You can also use the Action pop-up menu (
 ) to access this and other items.
 - Change the settings as desired. You can choose:
- the default analysis class.
- the position of the count label.
- black or white background.
- the color of each bar.