Open the Research Analytics Zone
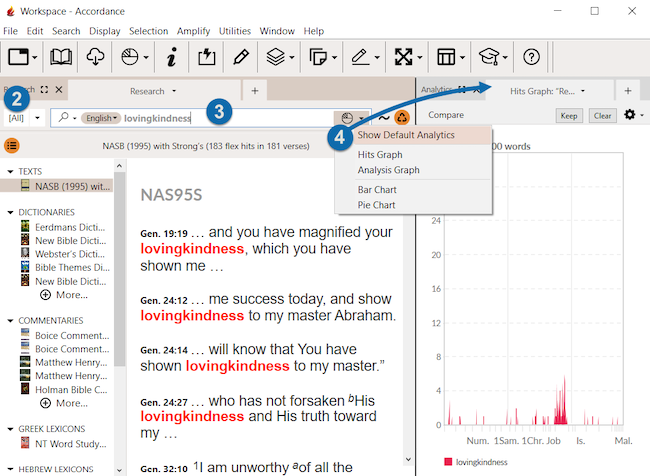
- On the File menu choose New Tab>Research. A new Research Tab opens.
- Select any Search Group that contains Text modules
 Any Bible text, or other single tool that can be read in Accordance, including reference texts and articles; may also be referred to as content or resource. For this example you'll select [All Texts] from the Research Groups pop-up menu.
|
Note Research Analytics can only be performed on Text modules. A Search Group can be selected that contains both Texts and Tools, but the analytics will only be performed on the Text modules. |
- Perform a Word search. For example, search for the word "lovingkindness."
- Click the Analytics button (
 ) and choose one of the five Analytics options. Analytics options include:
- Show Default Analytics: Opens the default analytics options in a new zone. Hits Graph is the default, and is set in the Search Tabs Preferences pane.
- Hits Graph: The Hits graph displays the density of hits across the search range. It is used to identify overall trends in the search results.
- Analysis Graph: The Analysis Graph is similar to the Hits Graph as it displays hits across the search range. However, instead of allowing addition of other searches, it breaks down the results of a single search.
- Bar Chart: The Bar Chart is similar to the Analysis Graph. However, it displays the search results with the total number in each class as simple bars, without the distribution across the search range.
-
Pie Chart: The Analysis Pie Chart presents the same information as in the Analysis Bar Chart, but as the familiar Pie Chart.
The desired Analytics tab is displayed in a zone.
The Research Analytics zone title reflects the Search tab![]() The core tab used to search Bible texts, it consists of a search entry area and a search results area to which the displayed Research Analytics belong.
The core tab used to search Bible texts, it consists of a search entry area and a search results area to which the displayed Research Analytics belong.
